
16.2: Analyze Slides And Responses
Slide analytics help you separate a reach problem from an understanding problem. A slide that few people reached may need a navigation or pacing change; a widely viewed question with weak responses may need clearer instruction or assessment wording.
In this section, you will compare slide reach, identify drop-off, inspect viewers, and analyze question answers.
Before You Begin
Open Report from the presentation editor. Basic Reports includes slide reach and viewer lists. Advanced Reports adds the Responses action and question-level score and selection percentages.
The current Slides report does not show average time per slide. Duration is available for an individual learner attempt in Advanced Reports, but it should not be described as slide-level time.
1. Compare Slide Reach
- Select the Slides tab.
- Read Viewed (%) for each slide. The count in parentheses is the number of unique viewers who reached the slide divided by the report's total unique viewers.
- Compare neighboring slides rather than judging one percentage in isolation.
- Select Refresh Data if new activity has just arrived.

A first slide near 100% followed by a sharp drop can indicate an early exit, a blocked interaction, or a navigation problem. A gradual decline in a long optional lesson may be expected. Interpret the pattern against the lesson's purpose and completion rule.
2. Identify A Meaningful Drop
Work from the learner's path:
- Find the first slide whose viewed percentage is materially lower than the previous slide.
- Check what the learner must do immediately before that slide: answer a question, select a button, finish media, or use a custom interaction.
- Preview that transition at desktop and phone widths.
- Review the presentation's toolbar, navigation, completion criteria, and resume setting.
- Change one likely cause, deliver the revised version, and compare later activity with the earlier baseline.
Do not assume that every low-view slide is defective. Optional references, branching destinations, remediation slides, and hidden answer-feedback paths may be expected to have smaller audiences.
3. See Who Reached A Slide
Select Viewers on a slide row. The detail view shows the slide title, a Viewed by x/y viewers summary, and the people who reached it. Select Back to return to the slide list.
Use this view when a learner says a later slide was unavailable or when you need to distinguish one person's navigation issue from a broader drop-off. Anonymous entries are described in Section 16.3.
4. Analyze Question Responses
In Advanced Reports, a question slide has a Responses action. It appears even when the slide has no viewers yet, so the action alone does not mean that answers were recorded.
- Select Responses on the question slide.
- Review the question and its Average Score when a score scale is available.
- Compare each Answer with Viewers Selected (%).
- Select an answer row to see which viewers selected it.
- Select Back once to return to the question, then again to return to the slide list.
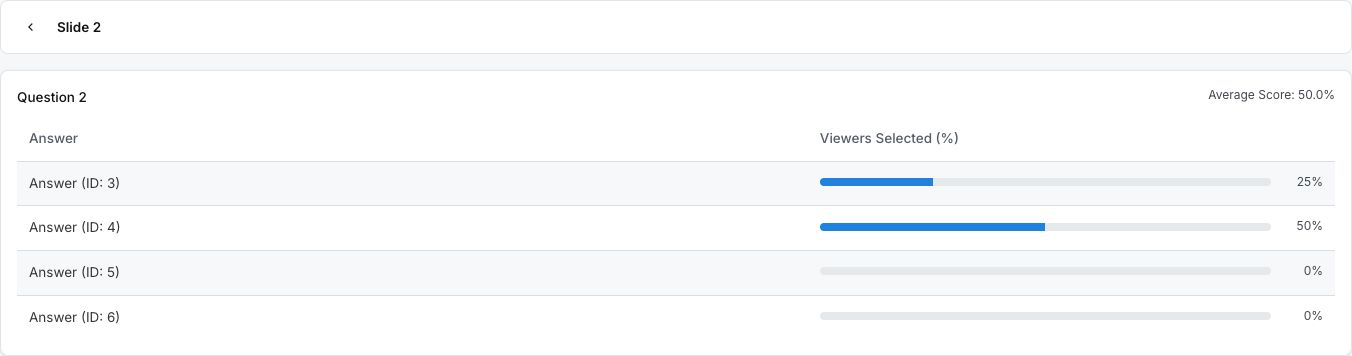
Selection percentages use the report's viewer population as the denominator. A zero can mean nobody chose the answer; it can also reflect viewers who did not reach or answer the question. Compare response data with the slide's viewed percentage before rewriting the question.
For matching, sequencing, drag-word, hotspot, image-answer, and other rich interactions, the answer column can show structured text, paired items, images, blank positions, or an identifier when historical metadata is unavailable.
5. Choose An Instructional Response
| Pattern | Useful follow-up |
|---|---|
| Reach drops before a question | Check the preceding navigation, media, interaction, or slide length. |
| Reach is high but average score is low | Review the instruction, question wording, scoring, and feedback. |
| One distractor dominates | Decide whether it reveals a genuine misconception or ambiguous wording. |
| Many viewers reached the slide but few selected any answer | Check whether submission is required and whether the control is usable on all target devices. |
| A branching or optional slide has low reach | Confirm that the smaller audience is intentional before changing it. |
The current presentation report has no date filter, search field, analytics export, or slide-time column. Record the observation date when you compare screenshots or results collected at different times.
Troubleshooting
| What happens | What to check |
|---|---|
| A slide shows 0% | Confirm that the delivered version contains that slide and that learners used a tracked path. |
| Responses is missing | It requires Advanced Reports and reported question data for that slide. A non-question slide shows only Viewers. |
| The viewer count looks higher or lower than expected | The denominator is unique report viewers, not attempts. Check learner identity and delivery context. |
| An answer has an ID instead of readable text | The historical statement could not be matched to current authored metadata. Review the delivered version. |
| You need time per slide | That metric is not exposed in the current presentation report. Use attempt Duration only as whole-attempt context. |
Previous: Read Presentation Reports · Next: Understand Learner Identity · Back to Part XVI · Back to the full guide