
9.3: Build And Format Tables
Use a table when learners need exact values or need to scan information by row and column. A table should make relationships easier to follow, not simply fit more text onto a slide.
In this section, you will insert a table, enter data, identify header structure, and format cells and borders.
Before You Begin
Open a presentation and select the destination slide. Reduce the source information to the rows and columns that support the learning objective. If a visual trend matters more than exact values, consider a chart instead.
1. Insert A Table Preset
Select Charts & Tables in the editor toolbox, then choose one of the three table presets.
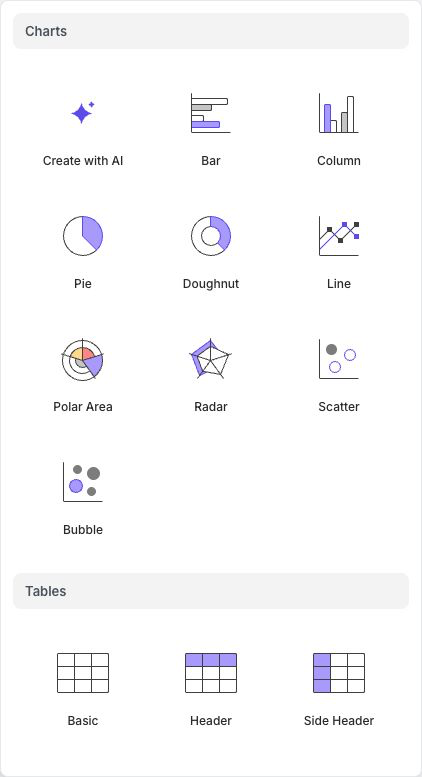
| Preset | Starting structure |
|---|---|
| Basic | Regular cells without a designated header row or column |
| Header | A header row across the top |
| Side Header | A header column down the left side |
The preset is a starting point. After insertion, you can change whether the first row or first column is treated as a header.
2. Enter And Revise Cell Content
Select a cell, enter text-editing mode, and type the value. Repeat for the remaining cells. Keep headings short, use consistent units, and avoid paragraphs that force the table to become too dense.
When a cell's text is active, use the floating text toolbar for font, size, text color, emphasis, lists, and alignment. Use the Text tab in Properties when you need the detailed character, paragraph, or text-box controls described in Section 6.1.
Select the table to show a round + button below its bottom edge, which adds a row, and another beside its right edge, which adds a column.
Move the pointer over a cell to show the row handle along the left edge and the column handle along the top edge. Select a handle to select that whole row or column and open a small bar of four icon-only buttons: move before, delete, insert, and move after. There is no context menu inside the table.
Use the handles to select related cells before applying a consistent text style. Click away from text-editing mode and select the table itself when you need table-wide properties.
3. Define The Header Structure
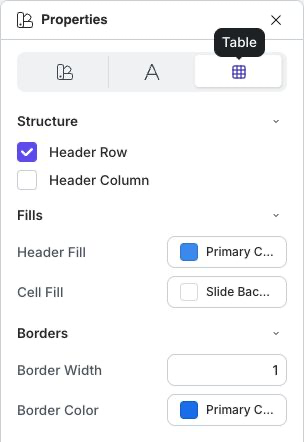
With the table selected, open Properties and select the Table tab. Under Structure:
- turn on Header Row when the first row names the columns; and
- turn on Header Column when the first column names the rows.
Both can be active when the table needs labels across the top and down the side.
Header styling helps learners understand the table's reading direction. Do not use a header appearance for ordinary data cells merely for decoration.
4. Format Fills And Borders
Under Fills, set Header Fill and Cell Fill. Use enough contrast for the text, and keep header and body fills distinct without making the table visually heavy.
Under Borders, set Border Width and Border Color. Thin, quiet borders usually guide the eye better than a dark grid around every value. If adjacent rows are difficult to track, combine subtle borders with spacing and concise content rather than adding more decoration.
Resize and position the table with the normal selection handles and Size & Position controls. Check the result in Present, especially on smaller screens.
5. Add A Formula To A Cell
To place mathematical notation in a cell, enter text-editing mode in that cell, position the insertion point, and use Insert Formula in the text toolbar. Follow Section 9.5 to build and revise the expression.
If The Table Does Not Work As Expected
| What you see | What to do |
|---|---|
| Typing replaces or moves the table | Enter text-editing mode inside the intended cell before typing. |
| Header colors are applied to the wrong cells | Check Header Row and Header Column under Structure. |
| The table is hard to scan | Shorten cell content, align comparable values consistently, and reduce unnecessary border contrast. |
| Text is too small in Present | Enlarge the table, split the content across slides, or remove less important columns. |
| Formula notation appears as plain text | Use Insert Formula instead of typing LaTeX directly into an ordinary cell. |
Quick Check
Before continuing, make sure that:
- the table is the clearest form for the information;
- row and column headings identify the data unambiguously;
- header structure, fills, and borders support scanning;
- units and number formats are consistent; and
- every cell remains readable in Present.
Previous: Configure Charts · Next: Create And Edit Infographics · Back to Part IX · Back to the full guide