
9.4: Create And Edit Infographics
Infographics organize a sequence, comparison, hierarchy, or relationship into a visual structure. Use one when the arrangement itself helps teach the idea; use ordinary text or a table when the visual pattern adds no meaning.
In this section, you will choose an infographic type, edit its content, change the item count, switch layouts, and reorder items.
Before You Begin
Write the main points in plain language first. Give each item one role in the explanation and keep labels parallel—for example, all steps as action verbs or all milestones as dated events.
1. Choose An Infographic Type
Select Infographics in the editor toolbox. The current gallery provides 14 types.
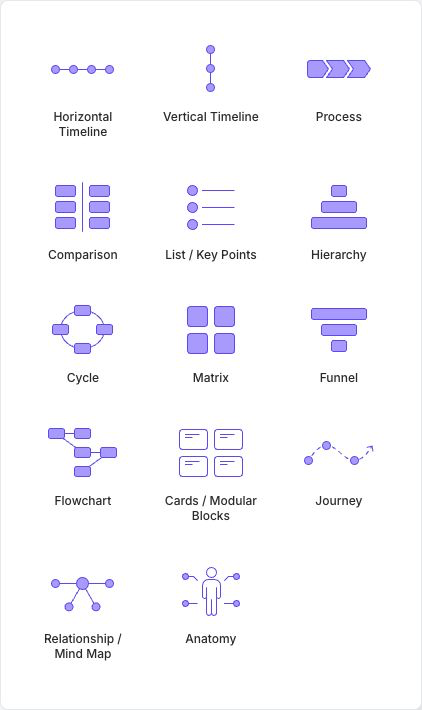
| Purpose | Available types |
|---|---|
| Sequence or progress | Horizontal Timeline, Vertical Timeline, Process, Cycle, Journey, Flowchart |
| Compare or organize | Comparison, List / Key Points, Matrix, Cards / Modular Blocks |
| Explain structure or relationships | Hierarchy, Funnel, Relationship / Mind Map, Anatomy |
Select the type that matches the idea. Only the types shown in the live gallery are currently available.
2. Replace The Placeholder Content
After insertion, select an individual text area in the infographic and enter text-editing mode. Replace its placeholder with the real date, title, label, or explanation. Keep item lengths similar so one block does not dominate the layout.
Edit every placeholder before publishing. A polished layout with sample years or generic labels is still incomplete course content.
3. Change The Type And Item Count
Select the infographic container and open Properties. The pane has no tab row for an infographic; scroll to Infographic Settings at the end of the pane. There:
- use Type to switch to another infographic layout; and
- enter an Items value from 1 to 20 to add or remove items.
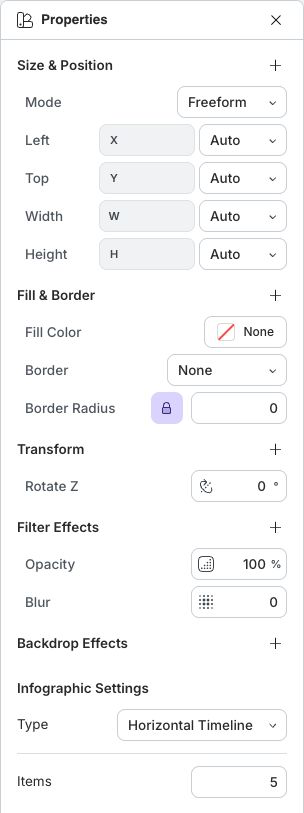
The selection toolbar also has Change Infographics Type, which switches the layout without opening Properties.
There is no separate orientation control. To change direction, choose the corresponding type, such as Horizontal Timeline or Vertical Timeline.
Changing the type preserves the infographic object but can reposition its content substantially. Reducing Items removes excess items, so copy any content you may need before lowering the count. After either change, review every label, connector, and text block.
4. Reorder Items
Select an individual infographic item, then drag it to a new position within the same infographic. Use reordering to fix the narrative sequence without retyping every block.
After the move, confirm that dates, step numbers, arrows, and connecting lines still express the intended order. An item can be reordered only within its own infographic container.
5. Style And Check The Result
Use the normal Styles controls to size, position, fill, border, rotate, or adjust the opacity of the infographic container. Edit text styling from the text toolbar or text properties while the relevant text is selected.
Keep contrast high and connectors visible. In Present, check the infographic at the learner's likely screen size and read it in the intended order. If the sequence is unclear without your narration, add labels or choose a more explicit layout.
If The Infographic Does Not Work As Expected
| What you see | What to do |
|---|---|
| A type from an older plan or example is missing | Use one of the 14 types shown in the current Infographics gallery. |
| Infographic Settings is not visible | Select the infographic container rather than only its text, then open Properties. |
| Changing Items removed content | Undo immediately, copy the content you need, then reduce the count again. |
| An item will not move to another infographic | Reorder only within the same container; recreate or copy the content in the destination infographic. |
| Text overlaps after a type change | Shorten the copy, resize the container, or choose a layout suited to the number and length of items. |
Quick Check
Before continuing, make sure that:
- the selected type expresses the intended sequence or relationship;
- no placeholder content remains;
- the item count matches the amount of information;
- the reading order is obvious after reordering or changing type; and
- text and connectors remain readable in Present.
Previous: Build And Format Tables · Next: Insert And Edit Formulas · Back to Part IX · Back to the full guide