
6.2: Use Shapes, Lines, And Connectors
Shapes can separate ideas, call attention to a rule, or turn a process into a visual explanation. Lines and connectors are especially useful for showing sequence, cause and effect, ownership, and branching decisions.
1. Open The Shape Library
Select Shapes on the right side of the editor. Use Search shapes… when you know what you need, or browse the categories.
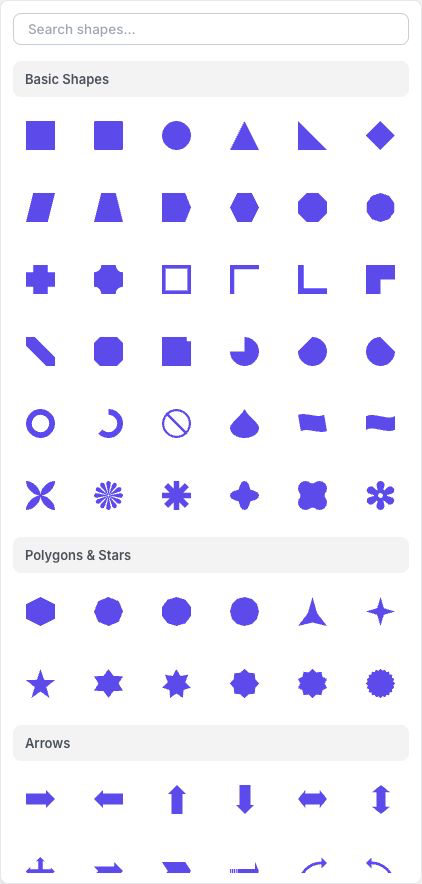
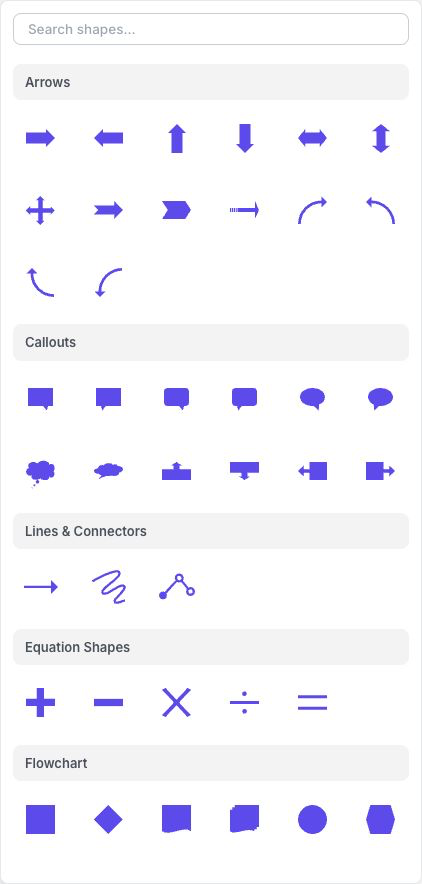
The current library contains:
| Category | Useful for |
|---|---|
| Basic Shapes | Cards, panels, highlights, frames, and simple diagrams |
| Polygons & Stars | Badges, ratings, emphasis, and decorative markers |
| Arrows | Direction, progress, and relationships |
| Callouts | Notes, speech, warnings, and annotations |
| Lines & Connectors | Processes, relationships, and linked diagram nodes |
| Equation Shapes | Plus, minus, multiply, divide, and equal symbols |
| Flowchart | Processes, decisions, documents, data, and other flowchart roles |
| Special Shapes | Hearts, moons, clouds, and lightning bolts |
| Progress | Progress bars and other progress indicators |
Select a shape to insert it on the current slide. Drag the object to place it, then use its handles or Properties to size it.
2. Change A Shape Without Rebuilding It
Select a compatible shape and use Change Shape in the selection toolbar. The dialog offers Search shapes… and seven groups: Basic Shapes, Polygons & Stars, Arrows, Callouts, Equation Shapes, Flowchart, and Special Shapes. Lines & Connectors and Progress are not offered here. Choose another shape from the library. The object remains in the slide, which helps preserve its position and other compatible styling.
Inspect the result after changing the shape. Different outlines can make text fit differently or expose more of a background.
3. Set Fill, Border, And Shadow
Use the selection toolbar for quick changes to background color, border, and drop shadow. For exact values, open Properties and use Fill & Border.
Keep diagram styling consistent. For example, use the same fill for all process steps, a distinct fill for decisions, and one arrow style throughout the flow. Too many colors and border styles make the diagram harder to decode.
4. Insert A Line Or Connector
Under Lines & Connectors, choose:
- Line Arrow for a straight or curved directional relationship;
- Freeform for a hand-drawn path; or
- Polyline for a path made from connected straight segments.
Drag the endpoint handles to connect the intended objects. Leave enough distance between nodes so arrowheads do not cover labels or disappear inside a shape.
5. Format A Connector
Select a Line Arrow to show its connector controls.
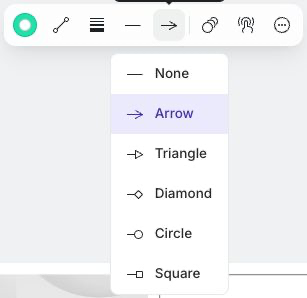
Use the controls to:
- set Border Color;
- switch between Straight line and Curved line;
- choose a solid, dotted, or dashed Line Style and its width;
- choose a Start Arrowhead; and
- choose an End Arrowhead.
The start and end menus offer None, Arrow, Triangle, Diamond, Circle, and Square. A Polyline also provides corner-rounding control in its line-style settings.
Arrow direction carries meaning. In a process, point from the prerequisite toward the result. In a concept map, be consistent about whether an arrow means “contains,” “causes,” or “leads to.”
6. Check The Diagram As A Learner
Select Present and confirm that:
- each label remains readable;
- connectors meet the intended objects;
- arrow direction is unambiguous;
- color is not the only signal that distinguishes diagram roles; and
- the complete diagram fits the learner's likely screen size.
If the slide feels crowded, divide the explanation across two slides or reveal parts with animations rather than shrinking every label.
Quick Check
Before continuing, make sure that you can:
- find a shape by category or search;
- change an existing compatible shape;
- create a consistent fill and border treatment;
- insert and position a line arrow, freeform line, or polyline; and
- set line style, curve, and start or end arrowheads.
Previous: Format Text And Manage Fonts · Next: Use Icons, Graphics, And Buttons · Back to Part VI · Back to the full guide