
16.1: Read Presentation Reports
A presentation report connects delivery with learning outcomes. Its summary tells you how much activity occurred; the learner rows explain whether people finished, passed, and where an individual attempt needs attention.
In this section, you will open a report, interpret its summary, compare learners, and inspect one attempt down to its slide and question responses.
Before You Begin
Open a presentation that learners have used through its hosted learner link. Editor preview is for author checks and does not create report activity. Class attempts belong to the class reporting context covered in Part XVII; standalone HTML5 keeps local state, while xAPI and SCORM packages report to their configured LRS or LMS rather than automatically entering this presentation report.
You need edit access to the presentation. Owners and editors can open Report; viewers and commenters cannot. The report surface also depends on the active subscription:
| Report | What it shows |
|---|---|
| Basic Reports | Unique viewers, each viewer's viewed-slide progress, the slide list, and the viewers who reached a slide. |
| Advanced Reports | Summary cards, detailed attempt status and scores, per-attempt drill-down, and question-response analysis. Advanced reporting is a Pro feature. |
1. Open The Report
- Open the presentation in the editor.
- Select Report in the top bar. At narrower widths, open More and select Report.
- Wait for Basic Reports or Advanced Reports to load.
- Select Refresh Data when learners have just completed activity and the current view has not caught up.
- Select View in New Tab when you want more room for the tables. Select Close to return to editing.
On a Free plan, View Advanced Reports opens the upgrade flow. Upgrading returns you to the advanced report you requested.
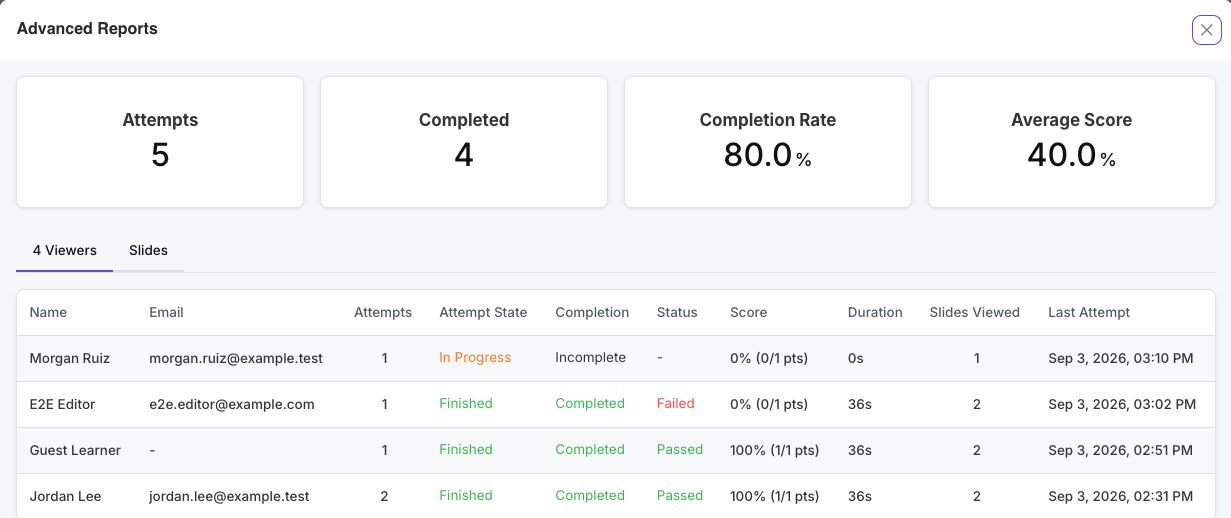
2. Read The Advanced Summary
The cards count attempts, not just people. One learner can contribute several attempts.
| Card | How it is calculated | What to ask next |
|---|---|---|
| Attempts | All reported attempts, including attempts still in progress. | Is the count consistent with the audience and retry policy? |
| Completed | Attempts that met the presentation's completion condition. | Are learners reaching enough slides or scored content to complete? |
| Completion Rate | Completed attempts divided by all attempts. | Is a low rate caused by abandonment, access trouble, or a demanding completion rule? |
| Average Score | The mean percentage for attempts that contain usable scored content. | Do weak results cluster around a particular question or concept? |
Completed and Passed do not mean the same thing. Completion follows the completion criteria; pass or fail follows the success criteria. A learner can finish the lesson and still fail its score target. An in-progress attempt can also contribute a current score when scored content has already been recorded.
If there is no report activity, the counts are zero and the table shows No data. Confirm that learners used a tracked delivery path before treating this as an analytics problem.
3. Read The Viewers Table
In Advanced Reports, the first tab is labeled with the current viewer count. Each row summarizes that viewer's latest attempt:
- Attempts is the number of attempts associated with the viewer.
- Attempt State distinguishes a finalized Finished attempt from In Progress activity. It also reports Unfinalized attempt (resumable) for an attempt the learner can still return to.
- Completion is Completed or Incomplete according to the presentation's completion criteria.
- Status is Passed, Failed, or a dash when there is no reported success result yet.
- Score shows a percentage and raw points when the presentation has scored content.
- Duration is time recorded for the latest attempt.
- Slides Viewed counts distinct slides reached in that attempt.
- Last Attempt shows the latest reported access time in the current interface locale.
Treat a row as a starting point, not a verdict. For example, In Progress with one slide viewed suggests that the learner may return, while Finished, Completed, and Failed points to an assessment result that deserves review.
4. Drill Into A Learner Attempt
- Select a learner row.
- If the learner has more than one attempt, select a numbered attempt. The star marks the best scored attempt.
- Compare Attempt State, Completion, Status, Score, Started, Ended or Last accessed, and Duration. An attempt that a later attempt has replaced reports In Progress (superseded).
- Read the table below the summary. A check under Viewed confirms that the slide was reached.
- For each question, inspect Attempts, Score, Status, and Response.
- Select the ‹ arrow beside the learner's name to return to all viewers. It shows an arrow only, without a Back label.
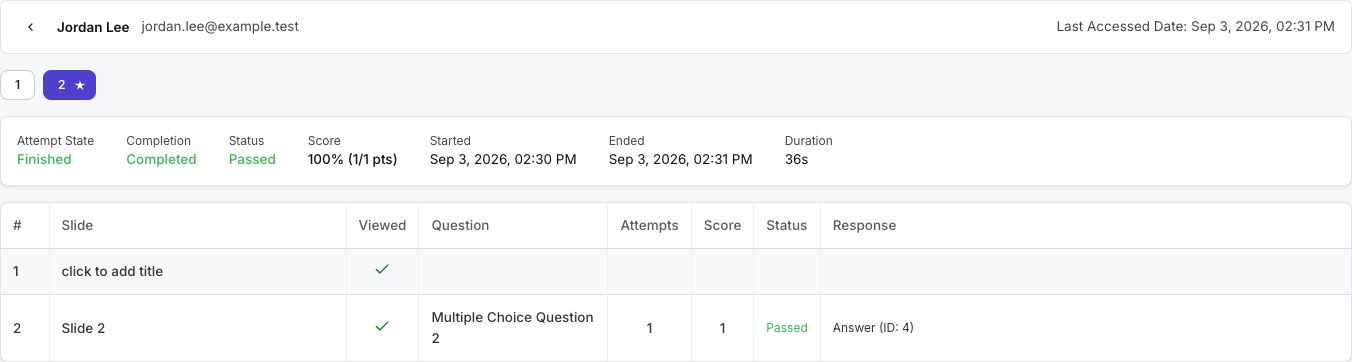
The Attempts value inside a question row counts recorded answers to that question in the selected presentation attempt. It is not the learner's presentation-attempt count shown above the table.
Responses normally use authored answer text or media. If historical data can no longer be matched to the current authored content, the report may show an answer ID instead. Keep a published version or source archive when an auditable record matters.
5. Turn The Report Into A Decision
Use the smallest change that addresses the evidence:
- Many in-progress attempts: check access, navigation, lesson length, and resume behavior.
- High completion but low success: review question clarity, instruction before the questions, and the success threshold.
- Several attempts with improvement: the retry path may be supporting practice as intended.
- Repeated wrong responses to one option: inspect that distractor and the teaching that precedes it.
- No usable score: confirm that questions are scored and that the delivery path reports score data.
Do not compare results across changed criteria without noting the change. Completion and success thresholds determine what the statuses mean.
Troubleshooting
| What happens | What to check |
|---|---|
| Report is unavailable or an error says you lack permission | Ask the owner for editor access. Viewer and commenter roles cannot open presentation reports. |
| Basic Reports opens instead of Advanced Reports | Advanced reporting requires Pro access in the active workspace. |
| The report is empty | Confirm that learners used this presentation's hosted learner link rather than editor preview. Check class, LRS, or LMS records separately for those delivery contexts, then select Refresh Data. |
| Completion and status appear to conflict | They use different rules: completion criteria and success criteria. Review both under presentation settings. |
| A recent learner result is missing | Allow the tracking request to finish, confirm the learner submitted or exited normally, then refresh once. |
| A response appears as an ID | The historical response could not be matched to current answer metadata. Compare it with the delivered version of the presentation. |
Previous: Manage Export Access And Source Data · Next: Analyze Slides And Responses · Back to Part XVI · Back to the full guide